What Two VW ID.7 Road Trips to Italy Really Cost
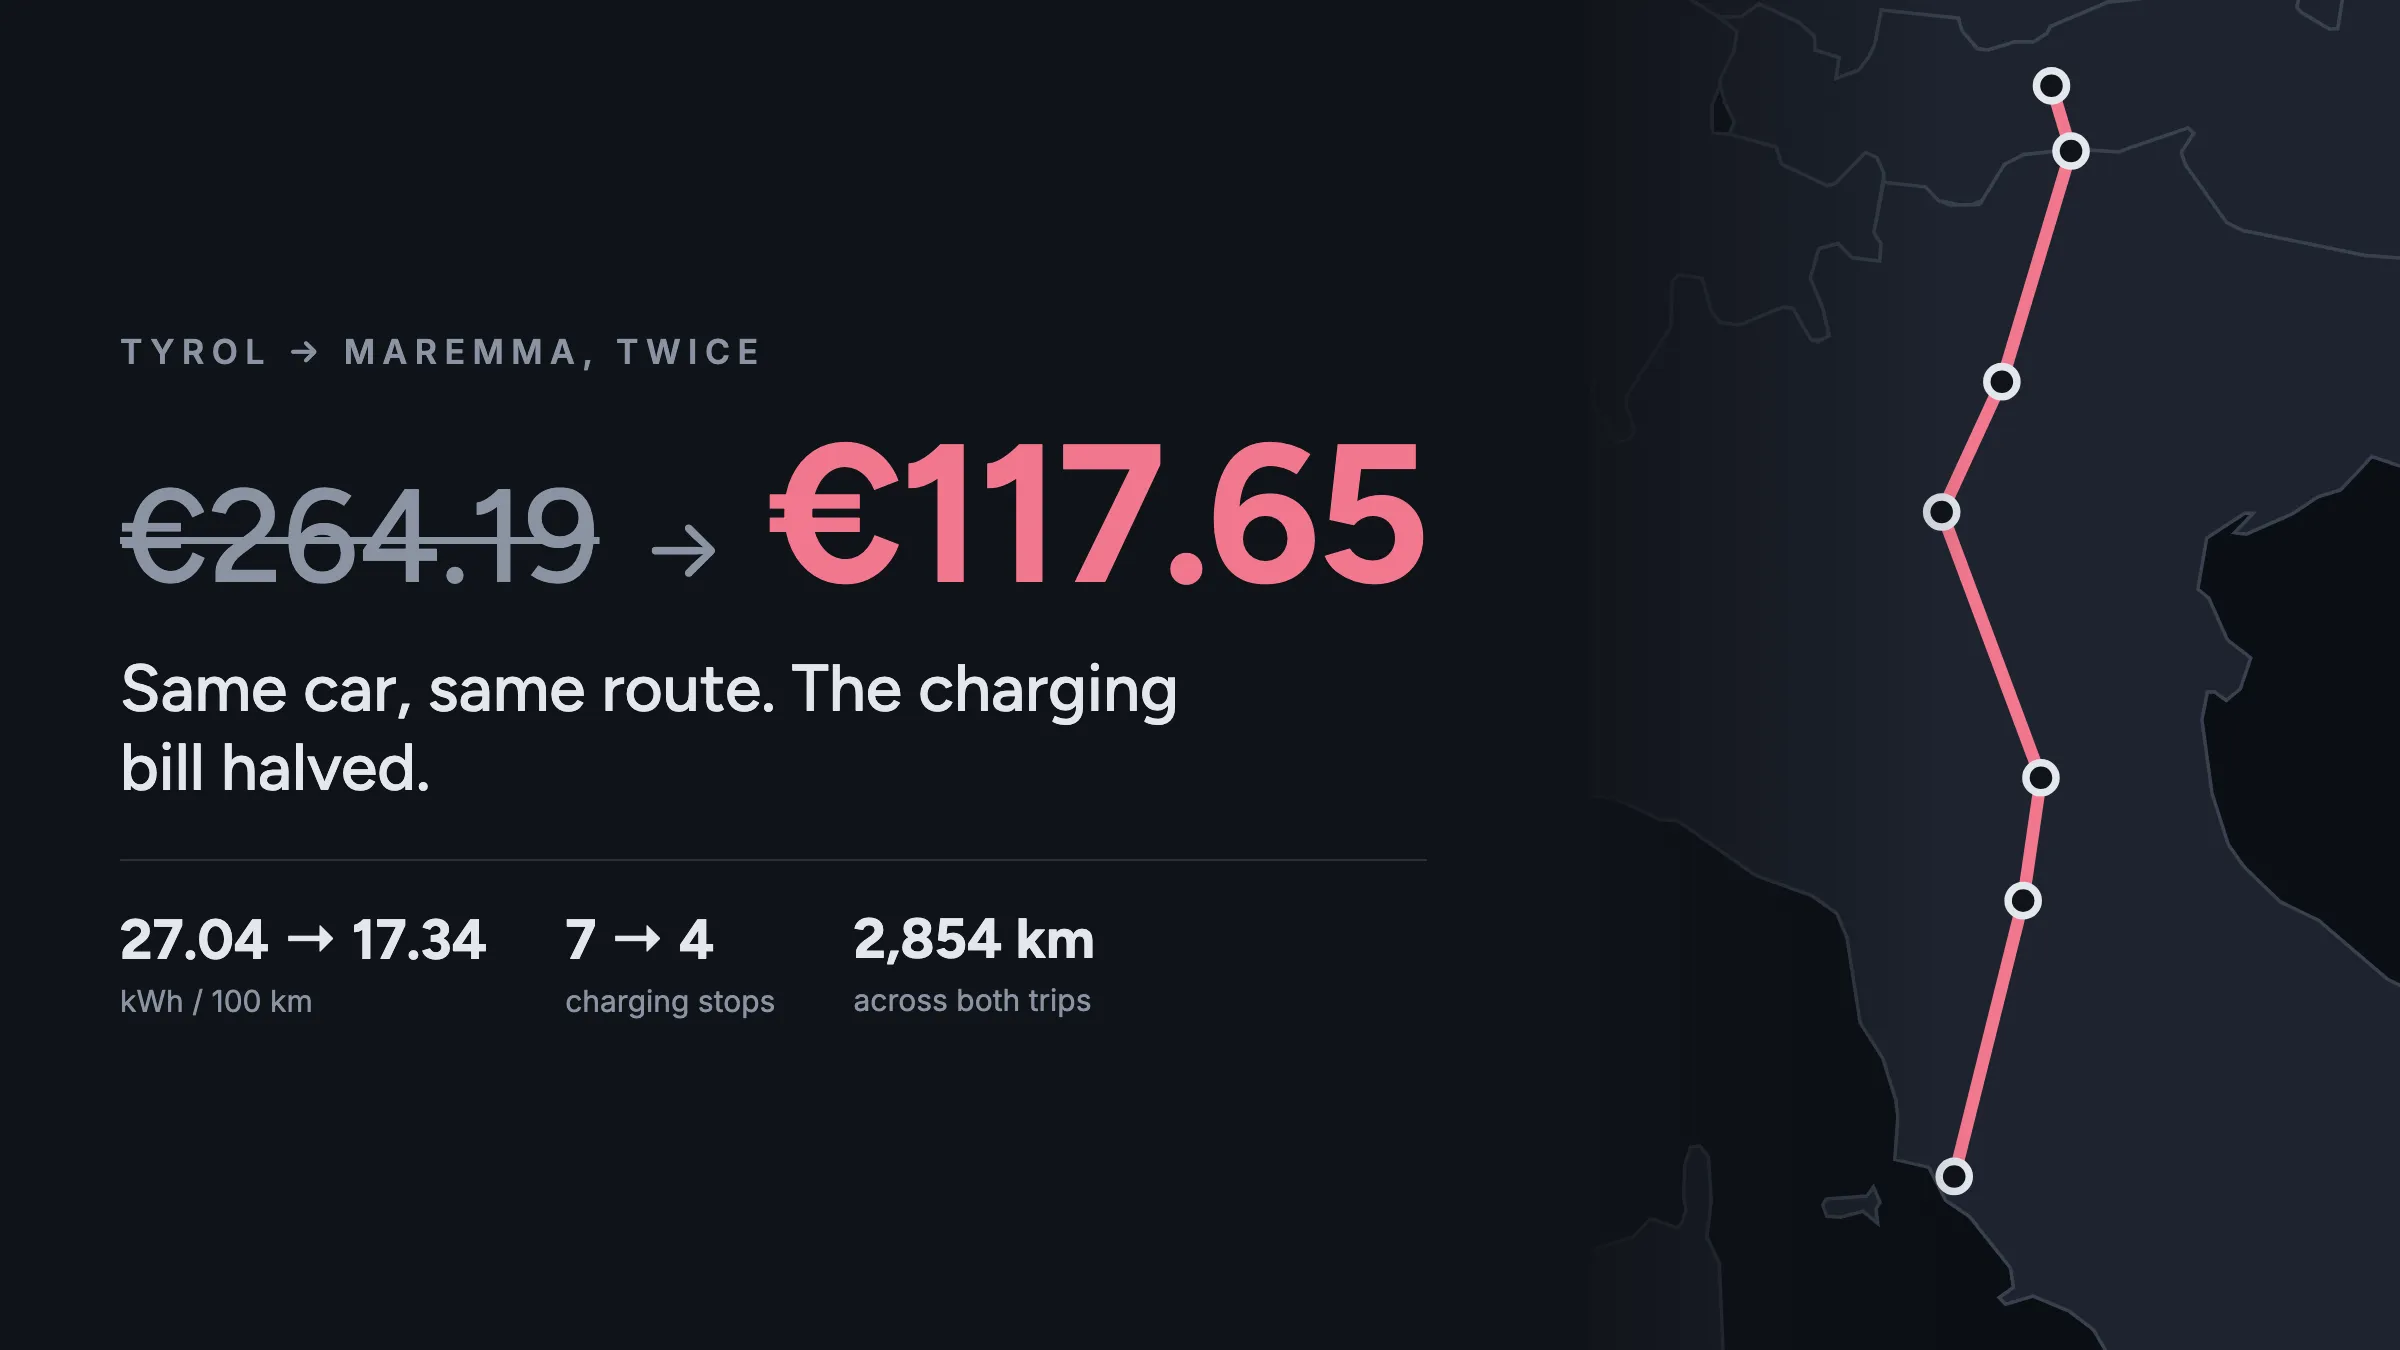
Two similar routes, one car and a very different result from the charging data.
I compared two VW ID.7 Tourer GTX journeys from Tyrol to Maremma using TRONITY driving and charging records. The spring trip averaged 27.04 kWh/100 km and cost €264.19. The summer trip averaged 17.34 kWh/100 km and cost €117.65. The car, route and driver were similar, but the bike carrier, load, speed, weather and charging tariff changed.
How I counted the cost: For each leg, I included charging on the travel day and the charge made immediately before departure. Charging during the holiday is excluded. Spring used IONITY Motion at €0.59/kWh and €5.99 per month. Summer used IONITY Power at €11.99 per month. My TRONITY account still had the spring Motion rate stored, so it priced the summer sessions at €0.59/kWh. I recalculated every summer IONITY session at the Power rate of €0.4820/kWh.
- Spring trip
- Summer trip
- Southbound
- Northbound
- Charged before departure
The result at a glance
| Trip | Distance (km) | Driving efficiency (kWh/100 km) | Charging records | En-route stops | Energy charged (kWh) | Charging cost (€) | Subscription (€) | Total (€) |
|---|---|---|---|---|---|---|---|---|
| Spring | 1,460 | 27.04 | 8 | 7 | 418.15 | 258.20 | 5.99 | 264.19 |
| Summer | 1,394 | 17.34 | 6 | 4 | 245.10 | 105.66 | 11.99 | 117.65 |
Driving consumption
36% lower consumption in summer.
Total trip cost
Totals include the relevant monthly IONITY subscription.
€146.54 less, a 55% reduction.
The summer subscription cost €6 more, but the complete journey cost €146.54 less. Cost per 100 km fell from €18.10 to €8.44.
Two holidays with different vehicle setups
In March, I drove from Tyrol to Maremma with three people, three bikes on a rear carrier and our luggage. I made the journey again in July, this time alone, with one e-bike inside the car and no rear carrier.
This was not a controlled test. Several variables changed together. The rack and bikes altered the car’s aerodynamics, the spring trip carried more weight, average speeds were higher and temperatures were lower. The charging tariff also changed.
The comparison therefore shows what the two complete setups cost. It does not measure the isolated effect of the bike rack.
- On board
- Spring: 3 people
- Summer: 1 person
- Bikes
- Spring: 3 bikes
- Summer: 1 e-bike
- Where the bikes rode
- Spring: On a rear carrier
- Summer: Inside the car
- Luggage
- Spring: For three
- Summer: For one
- Weather
- Spring: Cold, cabin heating on
- Summer: Warm, no heating

The four journey legs
| Trip and leg | Distance (km) | Energy used driving (kWh) | Driving efficiency (kWh/100 km) | Charging records | En-route stops | Energy charged (kWh) | Charging cost (€) |
|---|---|---|---|---|---|---|---|
| Spring outbound | 721 | 184.90 | 25.64 | 4 | 3 | 200.38 | 109.19 |
| Spring return | 739 | 209.84 | 28.40 | 4 | 4 | 217.77 | 149.01 |
| Summer outbound | 714 | 122.12 | 17.10 | 3 | 2 | 129.86 | 50.11 |
| Summer return | 680 | 119.54 | 17.58 | 3 | 2 | 115.24 | 55.55 |
A charging record is not always an en-route stop. The outbound totals include charging at home on the previous day. The summer return includes a late charge in Scarlino before the early departure. There was no charging session on the day before the spring return.
Energy purchased is also not the same as energy used while driving. Charging losses and different battery levels at the beginning and end of a leg prevent the figures from matching exactly.
Spring: 1,460 km and seven en-route stops
Outbound
The car used 184.90 kWh over 721 km, an average of 25.64 kWh/100 km. I charged at home before leaving and stopped three times on the journey south.
| Date and time | Location | Energy (kWh) | Cost (€) |
|---|---|---|---|
| 27 Mar, 16:30 | Home | 25.80 | 6.19 |
| 28 Mar, 05:53 | IONITY, Trento | 45.58 | 26.89 |
| 28 Mar, 08:48 | IONITY, Bologna | 67.94 | 40.08 |
| 28 Mar, 11:58 | IONITY, Scarlino | 61.06 | 36.03 |
The leg cost €109.19, including the departure charge.
Return
The return covered 739 km at 28.40 kWh/100 km, making it the least efficient of the four legs.
| Date and time | Location | Energy (kWh) | Cost (€) |
|---|---|---|---|
| 4 Apr, 05:30 | IONITY, Scarlino | 48.16 | 28.41 |
| 4 Apr, 08:22 | Enel X, Barberino di Mugello | 50.07 | 50.07 |
| 4 Apr, 11:30 | IONITY, Affi | 64.50 | 38.06 |
| 4 Apr, 14:24 | IONITY, Brennero | 55.04 | 32.47 |
The four sessions cost €149.01. The Enel X session in Barberino di Mugello was the most expensive individual charge: 50.07 kWh for €50.07.
Summer: 1,394 km and four en-route stops
Outbound
The summer journey south covered 714 km at 17.10 kWh/100 km. The car used 122.12 kWh while driving.
| Date and time | Location | Energy (kWh) | Cost (€) |
|---|---|---|---|
| 17 Jul, 13:03 | Home | 51.60 | 12.38 |
| 18 Jul, 07:03 | IONITY, Affi | 43.00 | 20.73 |
| 18 Jul, 09:24 | IONITY, Bologna | 35.26 | 17.00 |
Including the departure charge, the leg cost €50.11. I recalculated both IONITY sessions at the Power rate of €0.4820/kWh.
Return
I charged in Scarlino late on 30 July because I planned to leave early the following morning. That session belongs to the return journey even though it took place the day before the drive.
| Date and time | Location | Energy (kWh) | Cost (€) |
|---|---|---|---|
| 30 Jul, 22:03 | IONITY, Scarlino | 35.26 | 17.00 |
| 31 Jul, 06:45 | IONITY, Bologna | 28.38 | 13.68 |
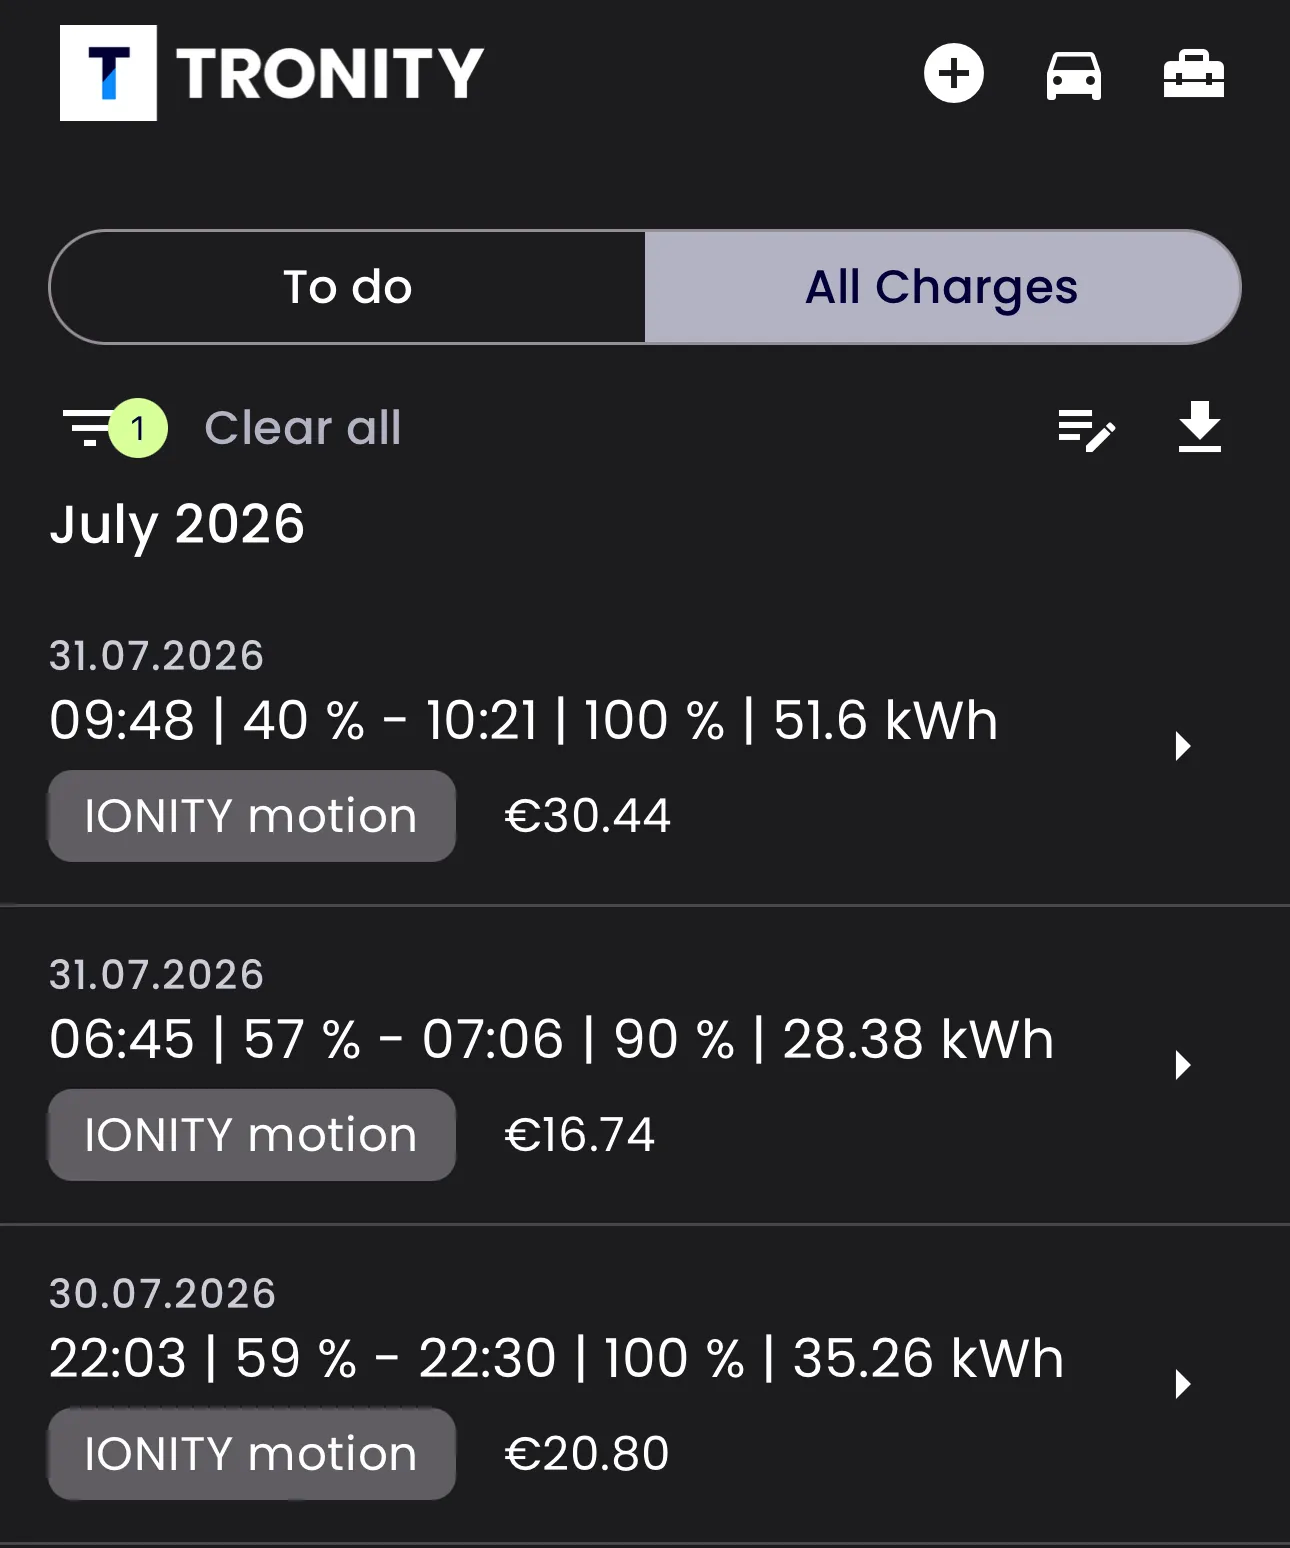
| 31 Jul, 09:48 | IONITY, Trento | 51.60 | 24.87 |
The return covered 680 km at 17.58 kWh/100 km. Its three charging records cost €55.55.
These are also the three sessions that show the tariff problem. TRONITY labels every one of them IONITY motion and prices them at €0.59/kWh, months after I moved to Power. The kWh figures are right and the prices are not.
Why the summer trip used less energy
The rear bike carrier is the most visible difference. Air resistance rises with the square of speed, so at motorway pace the shape of a car matters far more than its mass, and three bikes ruin the shape of a car built to be slippery.
The ADAC measured this on a Kia EV6. Bikes on a rear carrier cost about 8% extra at around 120 km/h. Bikes on the roof cost 25%, and a roof box 33%. Loading the car to its limit cost about 6%. Their conclusion is that aerodynamics, not weight, drives the difference.
That number is worth taking seriously, because it limits what my own carrier can explain. Eight percent is a long way short of the 36% between my two trips. The rest belongs to the other things that changed: two more people, two more bikes, more luggage, higher speeds and colder air.
Speed and weather changed as well. On the spring outbound legs, TRONITY recorded average speeds between 86.9 and 98.2 km/h. The long summer motorway legs were mostly between 78.9 and 85.3 km/h. July was also much warmer.
I cannot say that putting the bike inside caused the full 36% reduction. The figures show that the complete summer setup needed substantially less energy.
Did the IONITY Power subscription make the difference?
On the spring trip, I paid €0.59/kWh on IONITY Motion, with a monthly fee of €5.99. In July, I paid €0.4820/kWh on IONITY Power, with a monthly fee of €11.99.
The lower Power rate reduced the price of each IONITY session. It does not explain why the included summer charging records contained 245.10 kWh, compared with 418.15 kWh in spring. Most of the difference came from using less energy per kilometre.
A charging plan can lower the price of the electricity. It cannot compensate for an inefficient vehicle setup.
How this compared with my previous diesel
My previous VW Tiguan could cover the route on roughly one €102 tank, including journeys with bikes on the back.
The comparison is not exact because fuel and charging boundaries differ. Using the accounting method in this article, the ID.7 cost €109.19 for the spring outbound leg before allocating the subscription and €50.11 for the summer outbound.
The same electric car could therefore be close to the diesel’s fuel cost in one configuration and less than half of it in another.
What the trips say about advertised range
The ID.7’s official range is a standardised comparison figure. It is not a prediction for a fully loaded Alpine motorway trip with three bicycles attached.
During the spring trip, practical motorway intervals were often around 220–260 km before charging. In summer, the car completed a 310 km opening leg and arrived with 40% battery remaining.
I now treat the bike carrier, load, speed and weather as part of the vehicle configuration when planning a journey. One advertised range figure cannot describe all of those conditions.
Can this analysis be automated with TRONITY and n8n?
Reconciling the trips manually took longer than expected. Charging dates, energy and costs had to be checked session by session. The tariff stored with a record was not always the tariff that applied: my TRONITY account kept the old Motion rate after I moved to Power, so every summer session arrived with the wrong price attached.
TRONITY’s public API can provide charging history and current vehicle data. An n8n workflow could collect new charging sessions, normalise them, apply the tariff active on the date and group them into journey legs. The result could be stored in a spreadsheet or database and used to update an article draft.
Historical trip records remain the limitation. TRONITY does not currently document a public historical Trips endpoint equivalent to its charging-history endpoint. Earlier journeys may still require a spreadsheet or other export.
A practical workflow would run in six steps.
-
Pull
Collect new charging sessions from the TRONITY API.
-
Normalise
Bring the date, location, energy and network into one shape.
-
Price
Apply the tariff and subscription that were active on that date.
-
Group
Associate each session with a journey leg.
-
Calculate
Work out cost per leg and cost per 100 km.
-
Store
Save the result and update the article data.
This is the same type of problem I work on in workflow automation for business systems: collecting records from different sources, applying consistent rules and turning them into information that can be trusted.
ABRP can supply the planned route and a useful map, while TRONITY remains the source for what the car actually did. I would not treat an ABRP plan reopened months later as the original historical prediction because it can be recalculated using current conditions.
What I will change for the next trip
- Put bikes inside the car whenever possible.
- Treat an external carrier as an important range variable.
- Include the charge before departure when calculating trip cost.
- Keep en-route stops separate from all charging records.
- Separate energy used while driving from energy purchased.
- Save trip and charging data while it is still easy to reconcile.
- Automate tariff application rather than correcting it later.
Frequently asked questions
How much did the VW ID.7 road trip to Italy cost?
The spring round trip cost €264.19 for travel-related electricity and the IONITY subscription. The summer round trip cost €117.65.
How much did the VW ID.7 consume with bikes on the back?
The spring setup, with three bikes on a rear carrier, averaged 27.04 kWh/100 km. The summer setup, with one e-bike inside, averaged 17.34 kWh/100 km. The difference cannot be attributed entirely to the rack because speed, load and temperature also changed.
How many charging stops were required?
The spring journey required seven en-route charging stops across both directions. The summer journey required four. The accounting also includes the preparatory charging records made before early departures.
Was IONITY Power worth it?
The lower summer tariff helped, but most of the saving came from using less energy. The summer charging records included in the comparison contained 245.10 kWh, compared with 418.15 kWh in spring.
Can TRONITY charging data be processed with n8n?
Yes. An n8n workflow can collect charging history, normalise the sessions, apply tariffs and calculate journey costs. Historical driving records may still require a TRONITY export because an equivalent public historical Trips endpoint is not documented.
Conclusion
Across two Italy round trips, driving consumption fell from 27.04 to 17.34 kWh/100 km. Using the same accounting boundary for both holidays, travel-related electricity and subscription costs fell from €264.19 to €117.65.
The comparison does not isolate the effect of the bike rack. It shows how much the complete setup matters. Aerodynamics, speed, load and temperature influenced how much energy the car used. The charging tariff then determined what that energy cost.
For planning my next journey, both sides of that equation matter.
André Flitsch is a software developer in Tyrol working on e-commerce systems, integrations, data workflows and local-first AI tools. Read more at andreflitsch.com.